The Ultimate Guide to PlantUML Editor: Boost Your Diagramming Efficiency
SEO Meta Description: Discover the power of PlantUML Editor for creating UML diagrams effortlessly. Learn how to use PlantUML Editor, its features, and best practices to enhance your workflow.
Introduction to PlantUML Editor
PlantUML Editor is a powerful tool that allows you to create UML diagrams using a simple text-based language. Whether you’re a developer, architect, or project manager, PlantUML Editor can significantly streamline your diagramming process. This guide will walk you through everything you need to know about PlantUML Editor, from its basic features to advanced techniques.
What is PlantUML Editor?
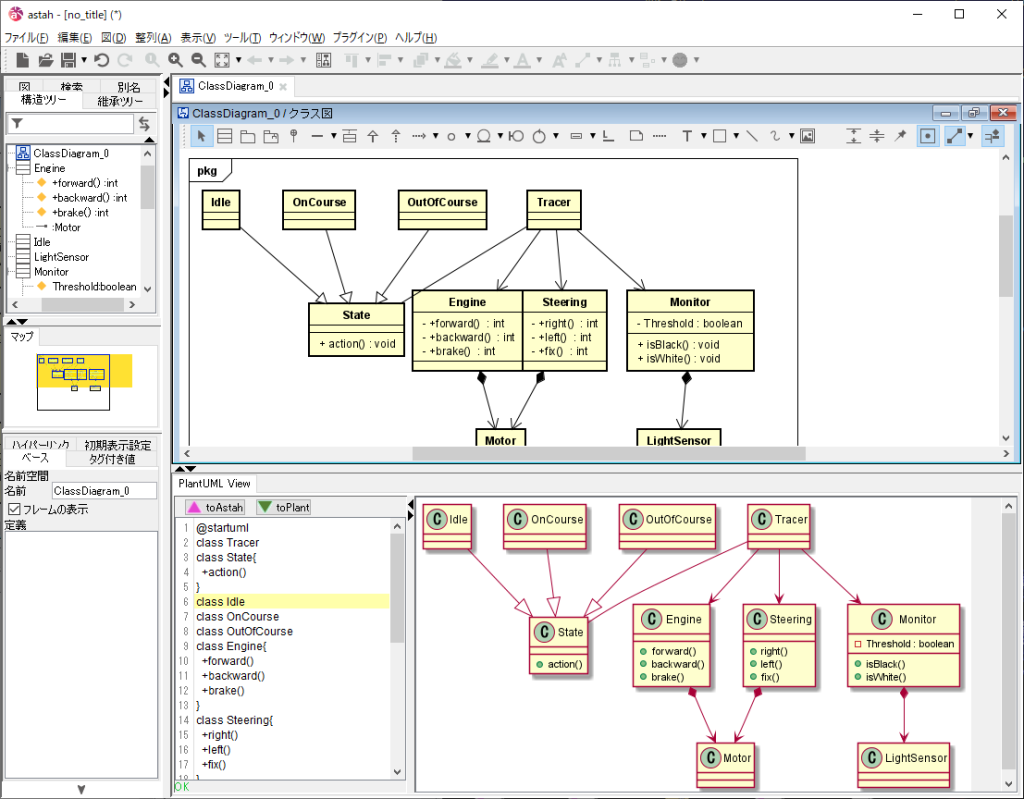
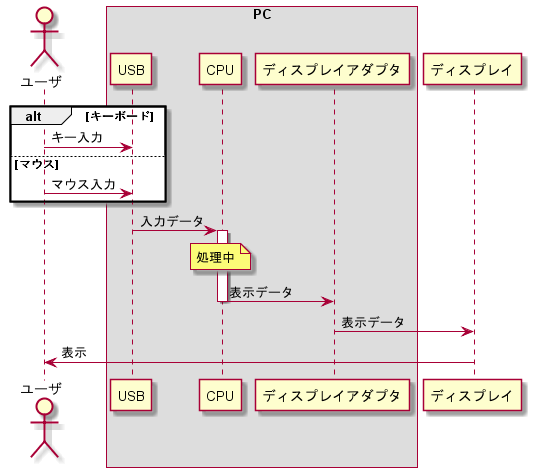
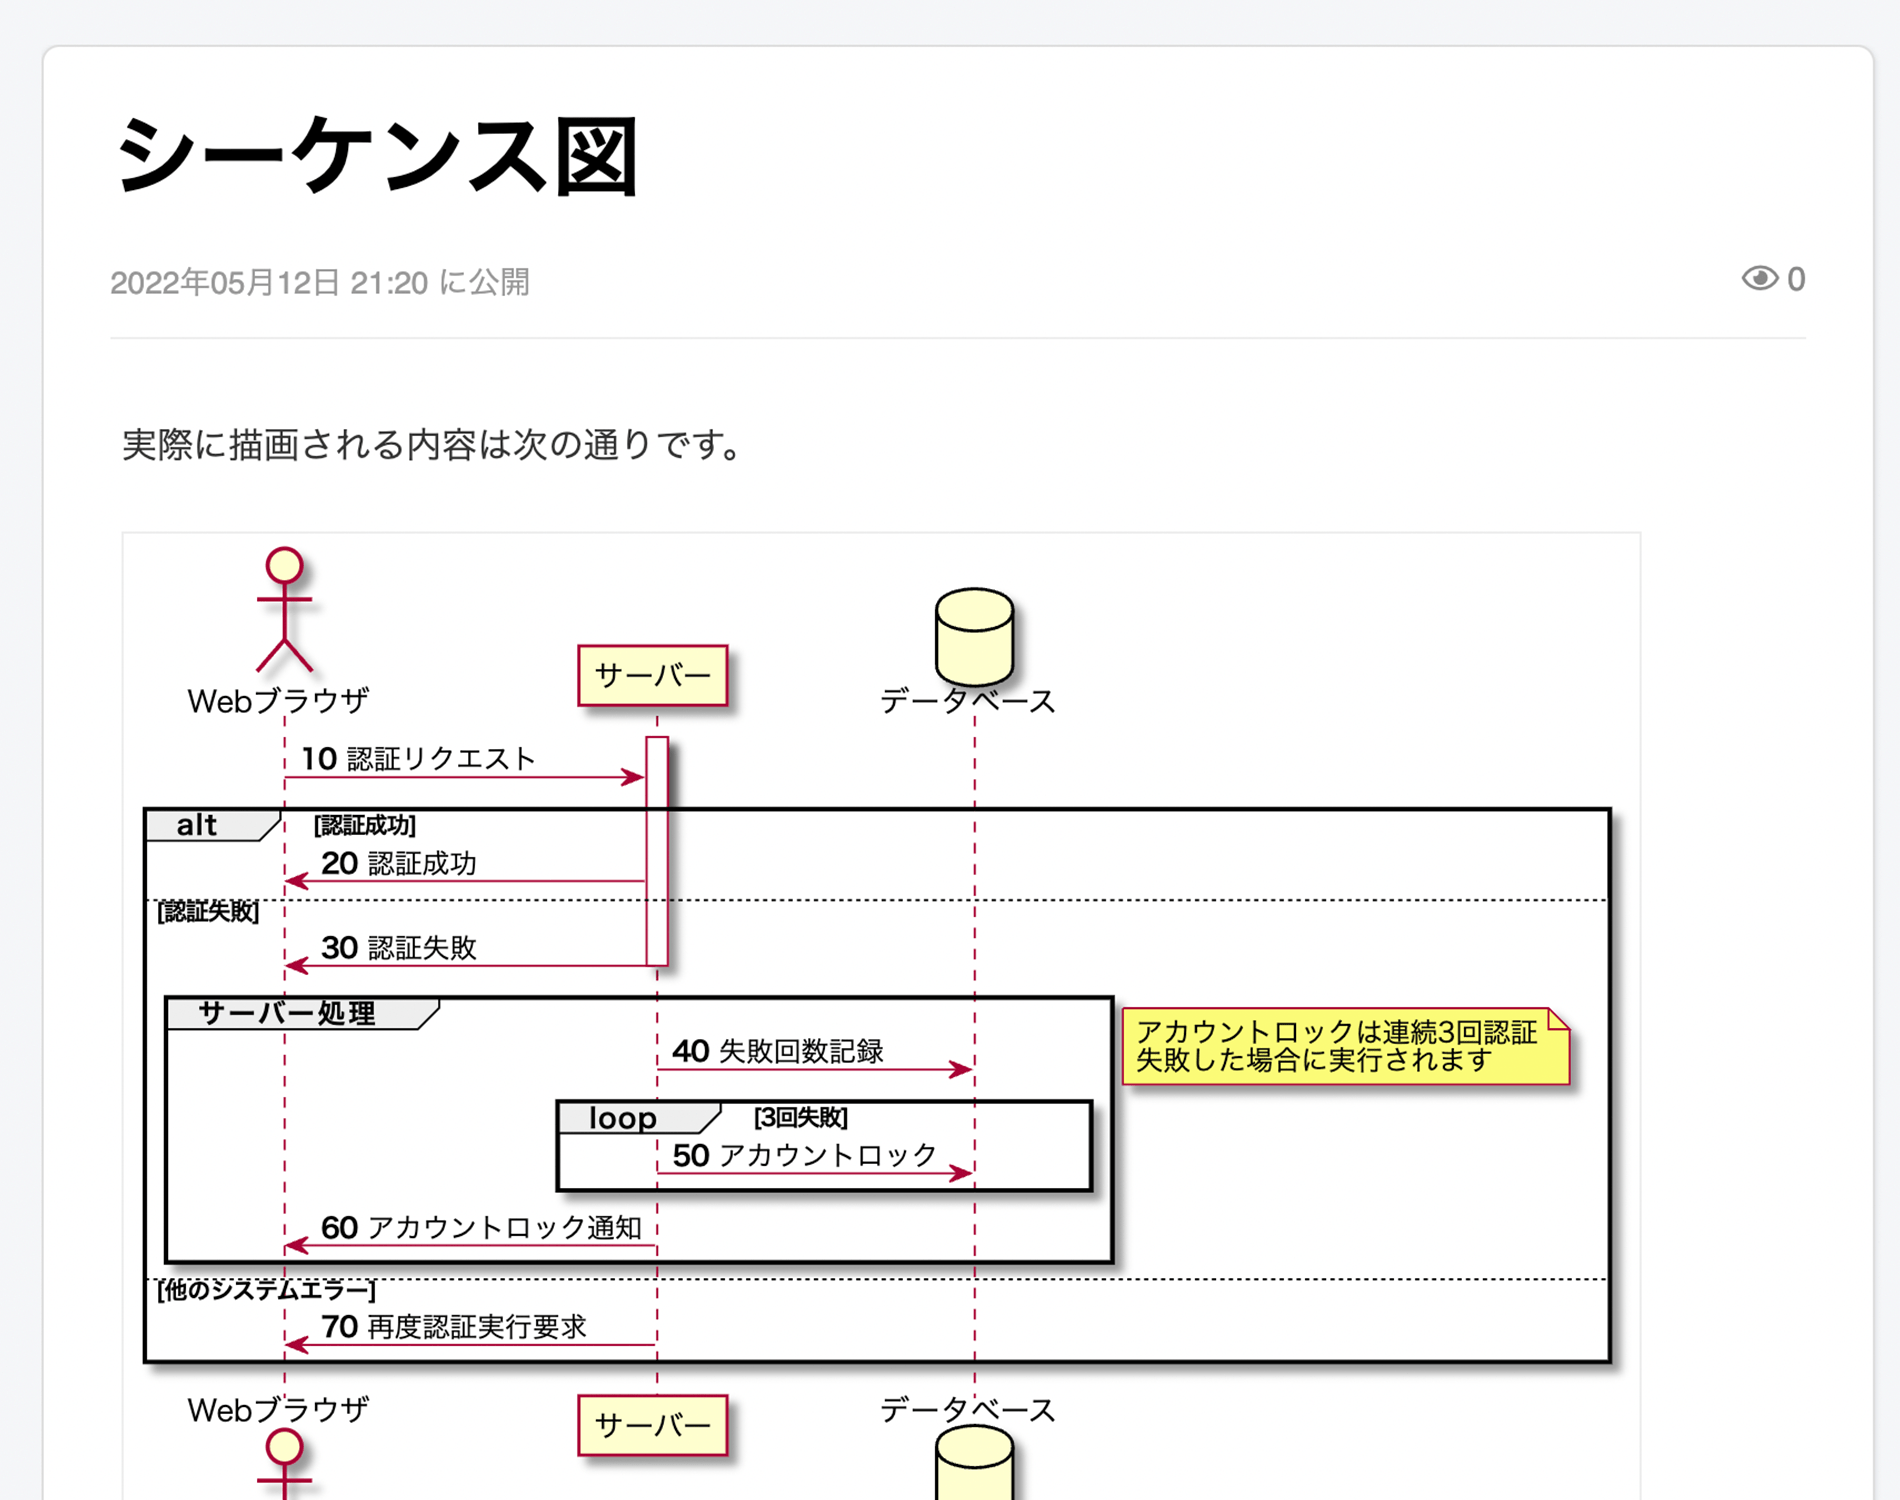
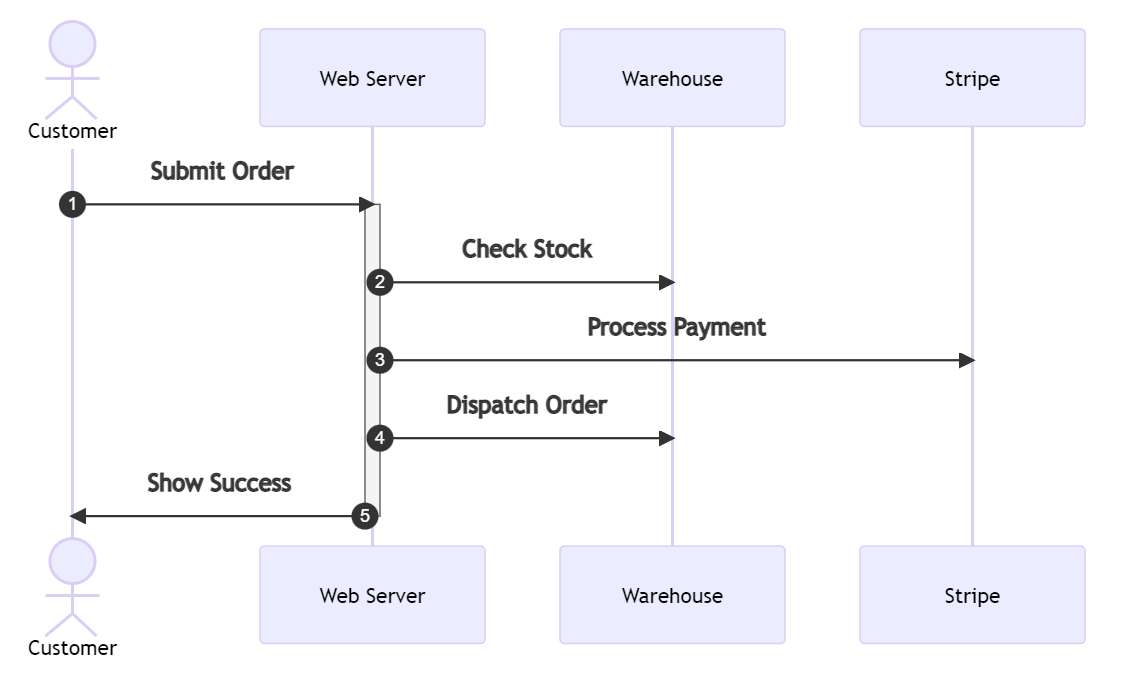
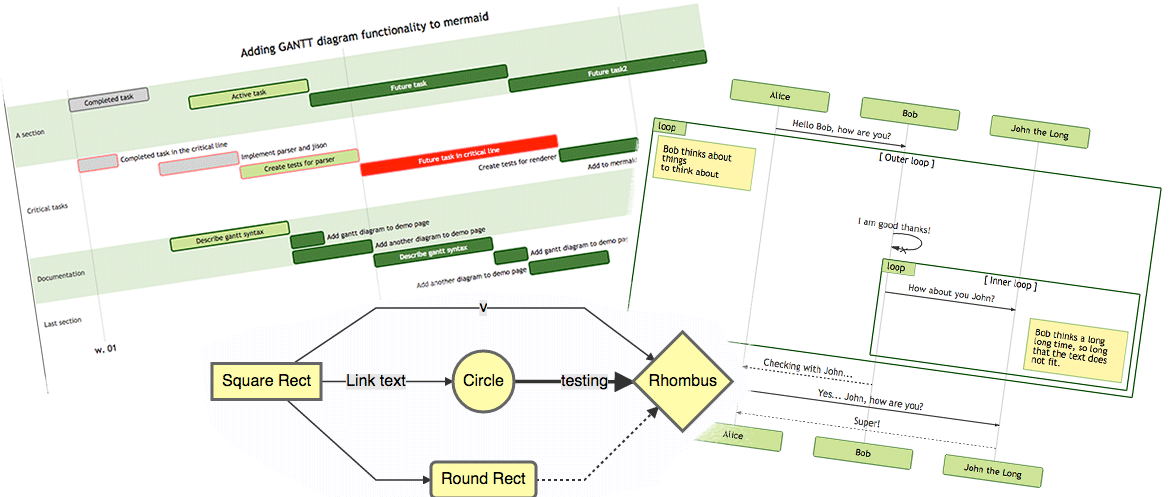
PlantUML Editor is a text-based tool that enables users to create various types of diagrams, including UML diagrams, sequence diagrams, and more. Unlike traditional graphical editors, PlantUML Editor uses a simple syntax that allows you to define your diagrams using plain text. This approach offers several advantages, such as ease of version control, simplicity, and the ability to generate diagrams programmatically.
Key Features of PlantUML Editor
- Text-Based Diagramming: Create diagrams using a simple text-based language.
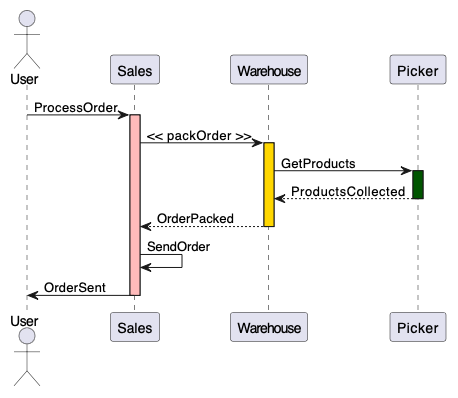
- Wide Range of Diagrams: Supports UML, sequence, activity, and many other types of diagrams.
- Version Control Friendly: Text files are easily managed with version control systems like Git.
- Extensive Libraries: Includes libraries for AWS, C4, and other popular frameworks.
- Customization: Easily customize diagrams with colors, styles, and more.
Getting Started with PlantUML Editor
To get started with PlantUML Editor, you’ll need to install the PlantUML software and set up your development environment. Here’s a step-by-step guide to help you through the process.
Step 1: Install PlantUML
PlantUML can be installed on various platforms, including Windows, macOS, and Linux. The easiest way to install PlantUML is through a package manager like Homebrew (for macOS) or Chocolatey (for Windows).
# For macOS
brew install plantuml

# For Windows
choco install plantuml
Step 2: Set Up Your Development Environment
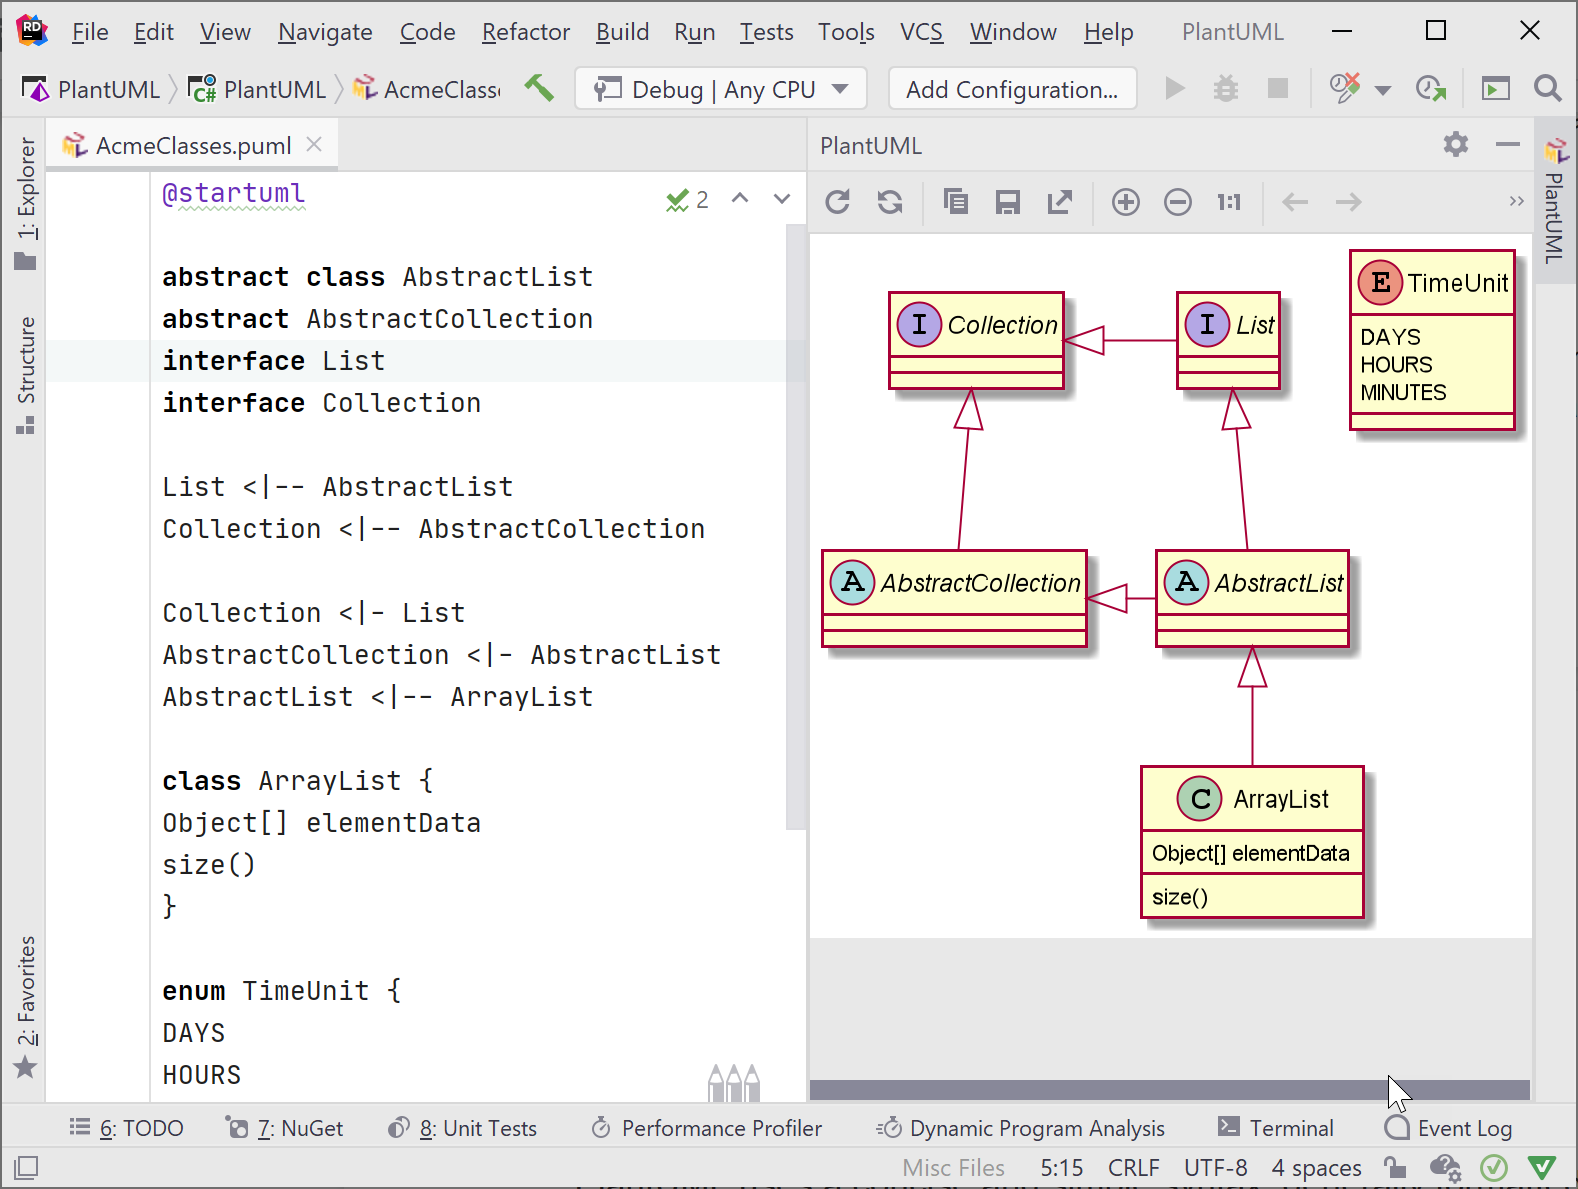
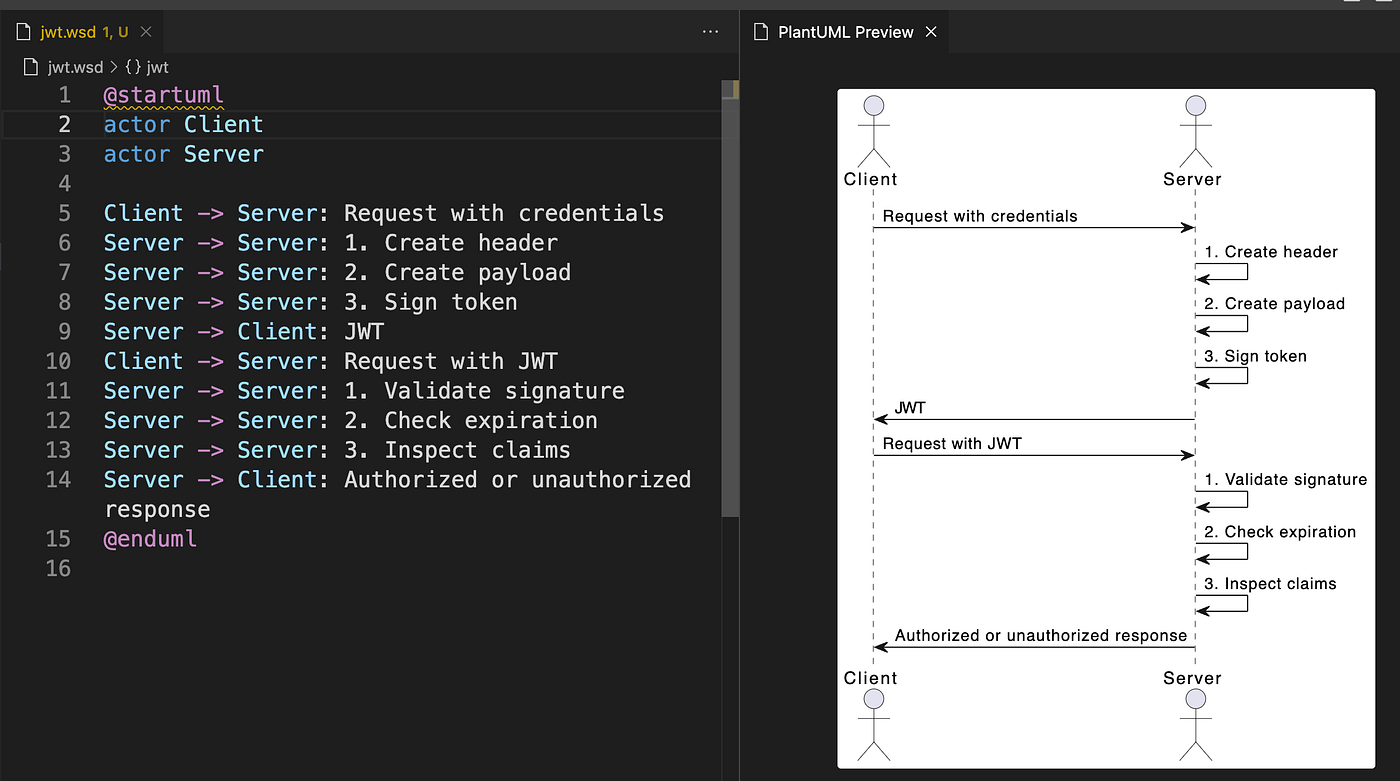
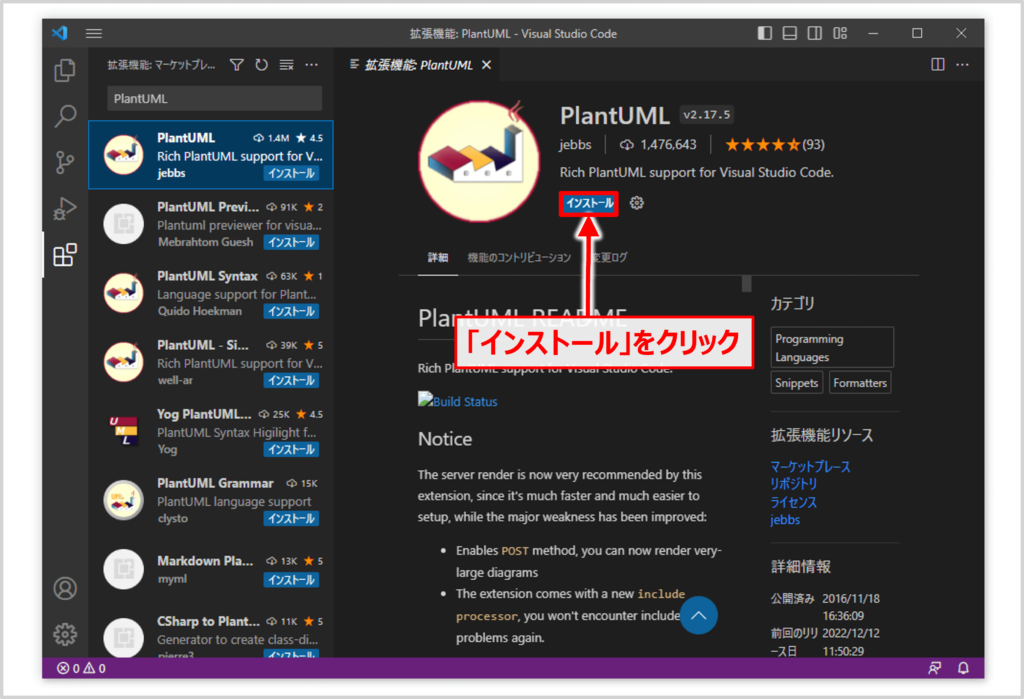
Once PlantUML is installed, you can integrate it with your favorite text editor or IDE. Popular editors like Visual Studio Code, IntelliJ IDEA, and Eclipse have PlantUML plugins that provide syntax highlighting, auto-completion, and preview capabilities.
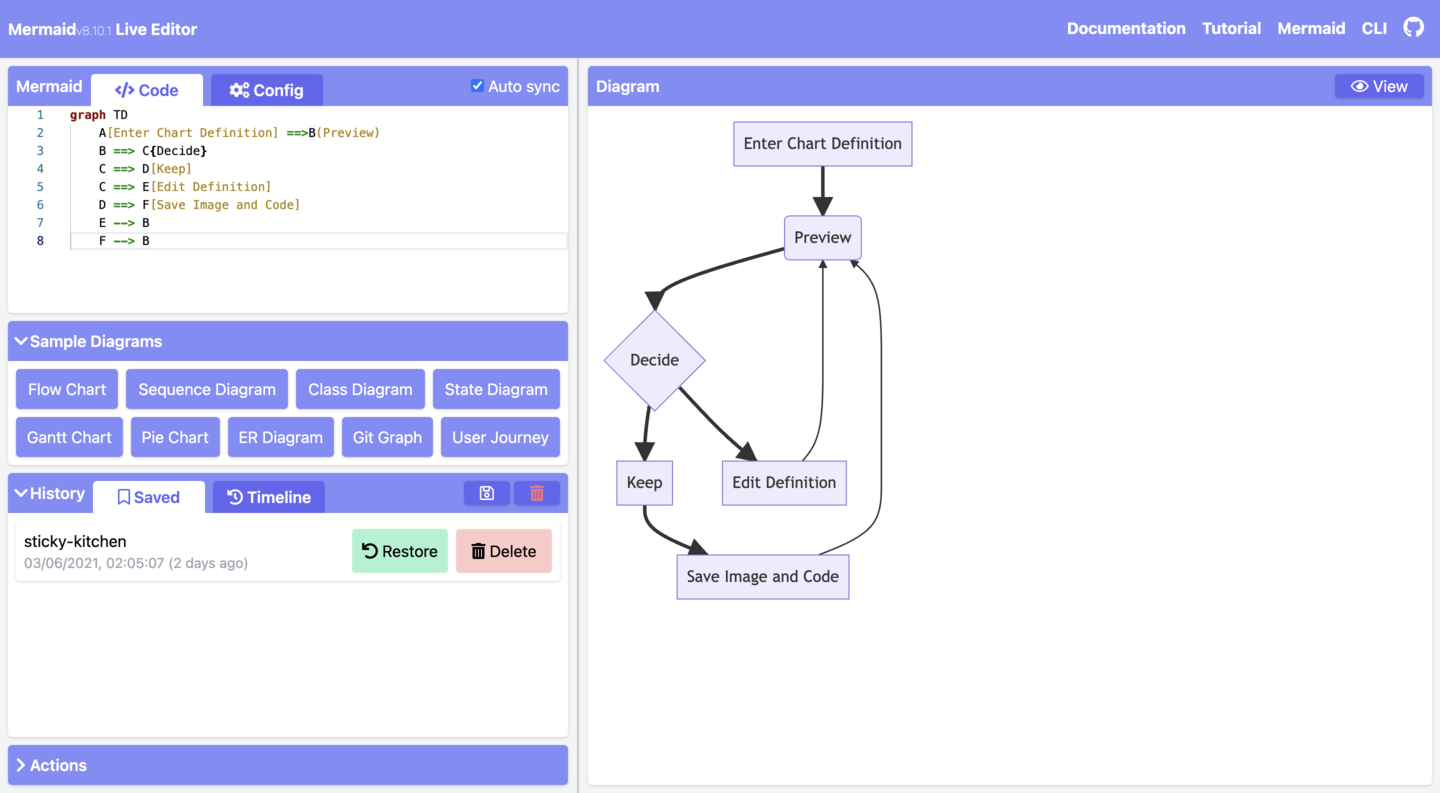
Step 3: Create Your First Diagram
Now that your environment is set up, you can start creating your first diagram. Here’s a simple example of a UML class diagram:
@startuml
class User {
  +String name
  +String email
  +void login()
  +void logout()
}
@enduml
This code defines a User class with attributes name and email, and methods login() and logout(). When you run this code, PlantUML will generate a visual representation of the class diagram.
Advanced Features of PlantUML Editor
PlantUML Editor offers a plethora of advanced features that can help you create more complex and visually appealing diagrams. Let’s explore some of these features in detail.
Using Libraries
PlantUML supports various libraries that provide pre-defined sprites and macros for popular frameworks and technologies. For example, the C4 library allows you to create C4 model diagrams with ease.
@startuml
!include <C4/C4_Container>
Person(personAlias, "Label", "Optional Description")
Container(containerAlias, "Label", "Technology", "Optional Description")
System(systemAlias, "Label", "Optional Description")
System_Ext(extSystemAlias, "Label", "Optional Description")
Rel(personAlias, containerAlias, "Label", "Optional Technology")
Rel_U(systemAlias, extSystemAlias, "Label", "Optional Technology")
@enduml
Customizing Diagrams
You can customize your diagrams by adding colors, styles, and other visual elements. PlantUML provides a wide range of options to make your diagrams more visually appealing.
@startuml
skinparam class {
  BackgroundColor<<MyClass>> Red
  BorderColor<<MyClass>> Blue
}
class MyClass <<MyClass>> {
  +String name
  +void method()
}
@enduml
Integrating with Version Control
One of the significant advantages of using PlantUML Editor is its compatibility with version control systems. Since diagrams are defined in text files, you can easily track changes, collaborate with others, and manage versions using tools like Git.
Best Practices for Using PlantUML Editor
To get the most out of PlantUML Editor, follow these best practices:
- Keep It Simple: Use simple and clear language to define your diagrams.
- Use Libraries: Leverage existing libraries to save time and effort.
- Version Control: Always use version control to manage your diagram files.
- Document Your Diagrams: Add comments and descriptions to make your diagrams more understandable.
Common Questions About PlantUML Editor
What is PlantUML Editor used for?
PlantUML Editor is used for creating various types of diagrams, including UML diagrams, sequence diagrams, activity diagrams, and more. It is particularly useful for software developers, architects, and project managers who need to create and manage diagrams as part of their workflow.
How do I install PlantUML Editor?
You can install PlantUML Editor using a package manager like Homebrew (for macOS) or Chocolatey (for Windows). Alternatively, you can download the PlantUML JAR file and run it using Java.
Can I use PlantUML Editor with my favorite text editor?
Yes, PlantUML Editor can be integrated with popular text editors and IDEs like Visual Studio Code, IntelliJ IDEA, and Eclipse. These editors have plugins that provide syntax highlighting, auto-completion, and preview capabilities.
Is PlantUML Editor compatible with version control systems?
Yes, PlantUML Editor is highly compatible with version control systems like Git. Since diagrams are defined in text files, you can easily track changes, collaborate with others, and manage versions.
How do I customize my diagrams in PlantUML Editor?
You can customize your diagrams by adding colors, styles, and other visual elements using PlantUML’s extensive customization options. For example, you can use the skinparam command to change the appearance of your diagrams.
Conclusion
PlantUML Editor is a versatile and powerful tool that can significantly enhance your diagramming workflow. Whether you’re creating UML diagrams, sequence diagrams, or other types of visual representations, PlantUML Editor offers a simple and efficient way to do so. By following the best practices and leveraging its advanced features, you can create clear, concise, and visually appealing diagrams that help communicate your ideas effectively. Start using PlantUML Editor today and take your diagramming skills to the next level!